
Full Stack Observability. AI-Powered Fixes.
Track every trace and log. Get instant insights with custom dashboards. Let AI detect issues, find root causes, and create pull requests with fixes.
Track every trace and log. Get instant insights with custom dashboards. Let AI detect issues, find root causes, and create pull requests with fixes.
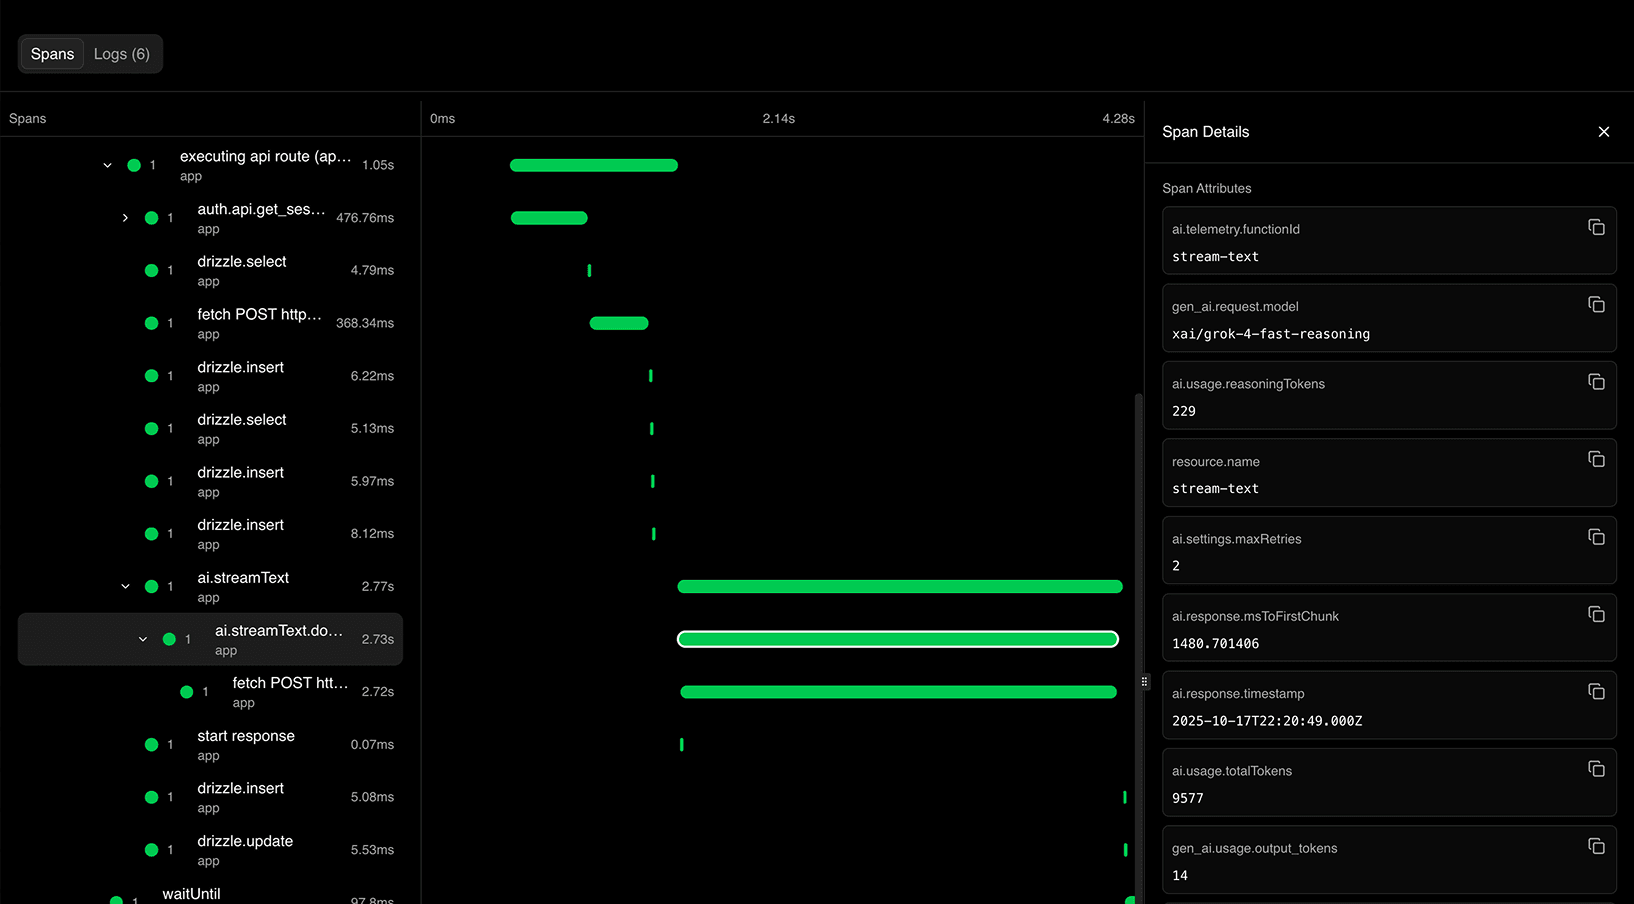
Distributed Tracing
Follow every request through your system. OpenTelemetry-native tracing shows you exactly what happens across services, databases, and APIs—with span-level precision.
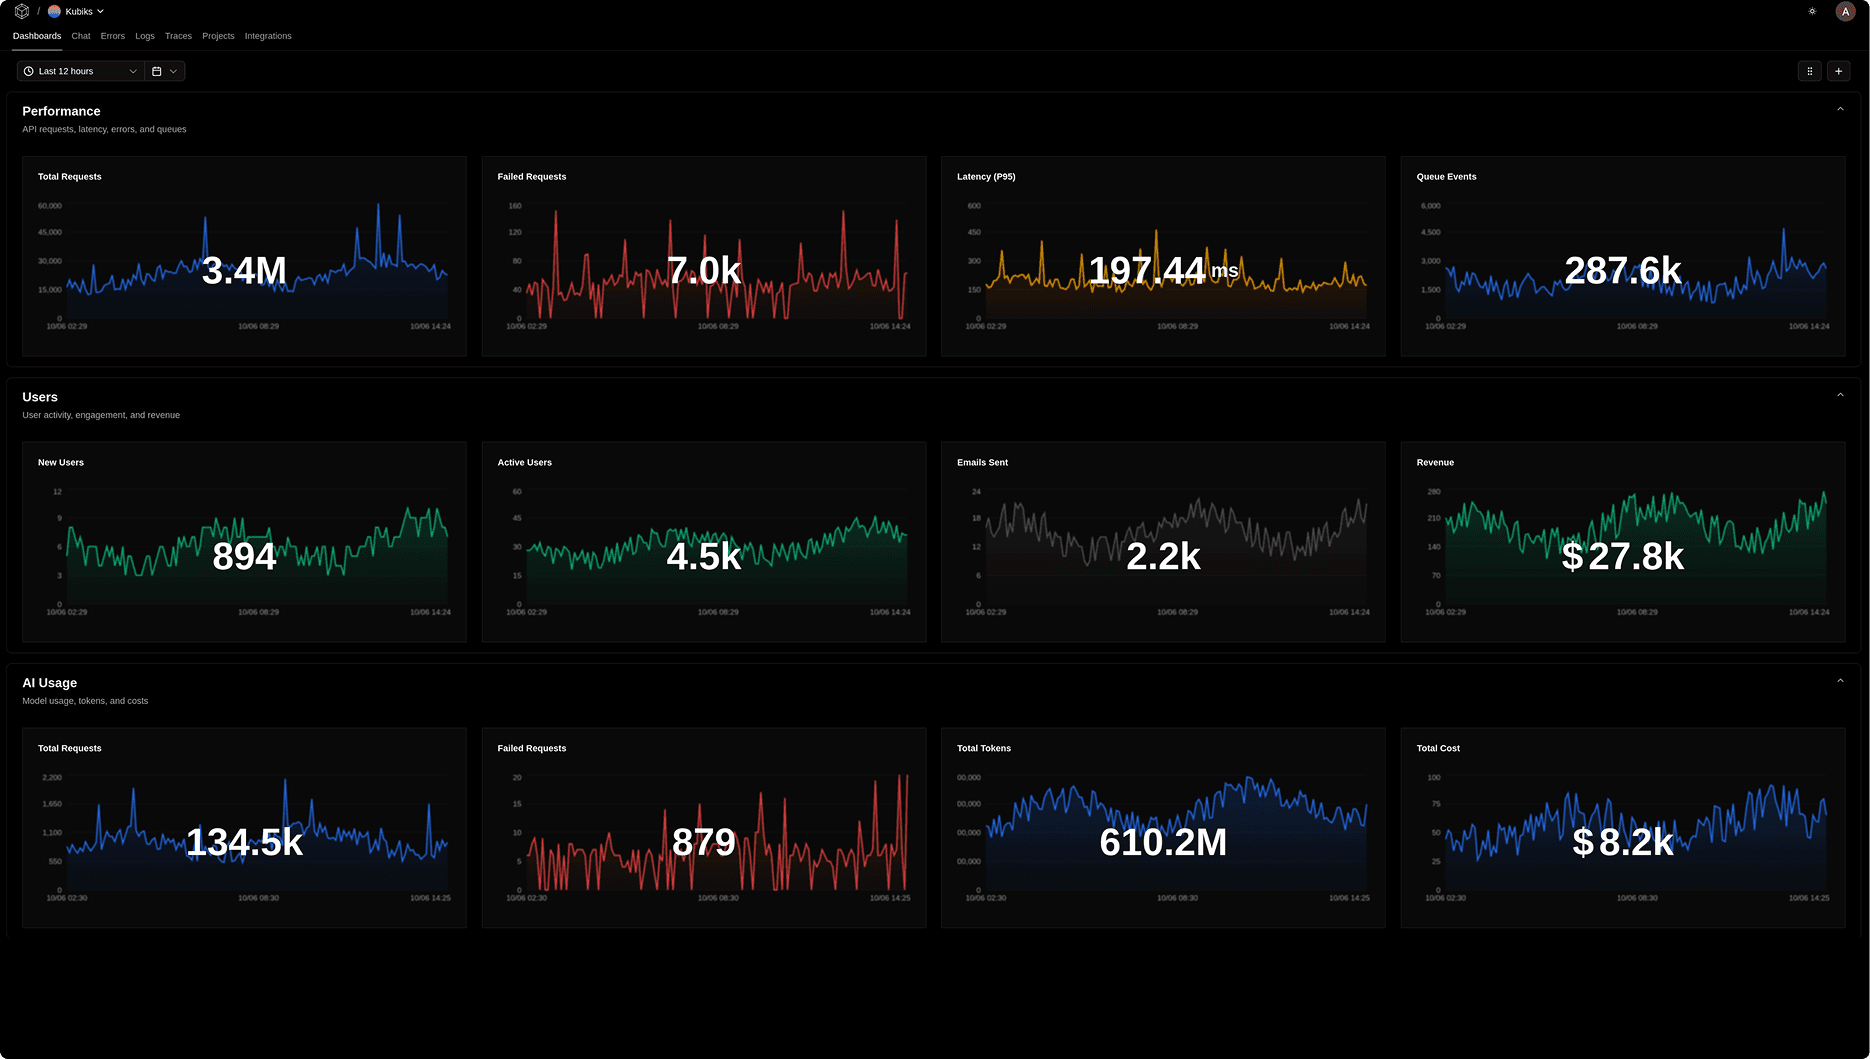
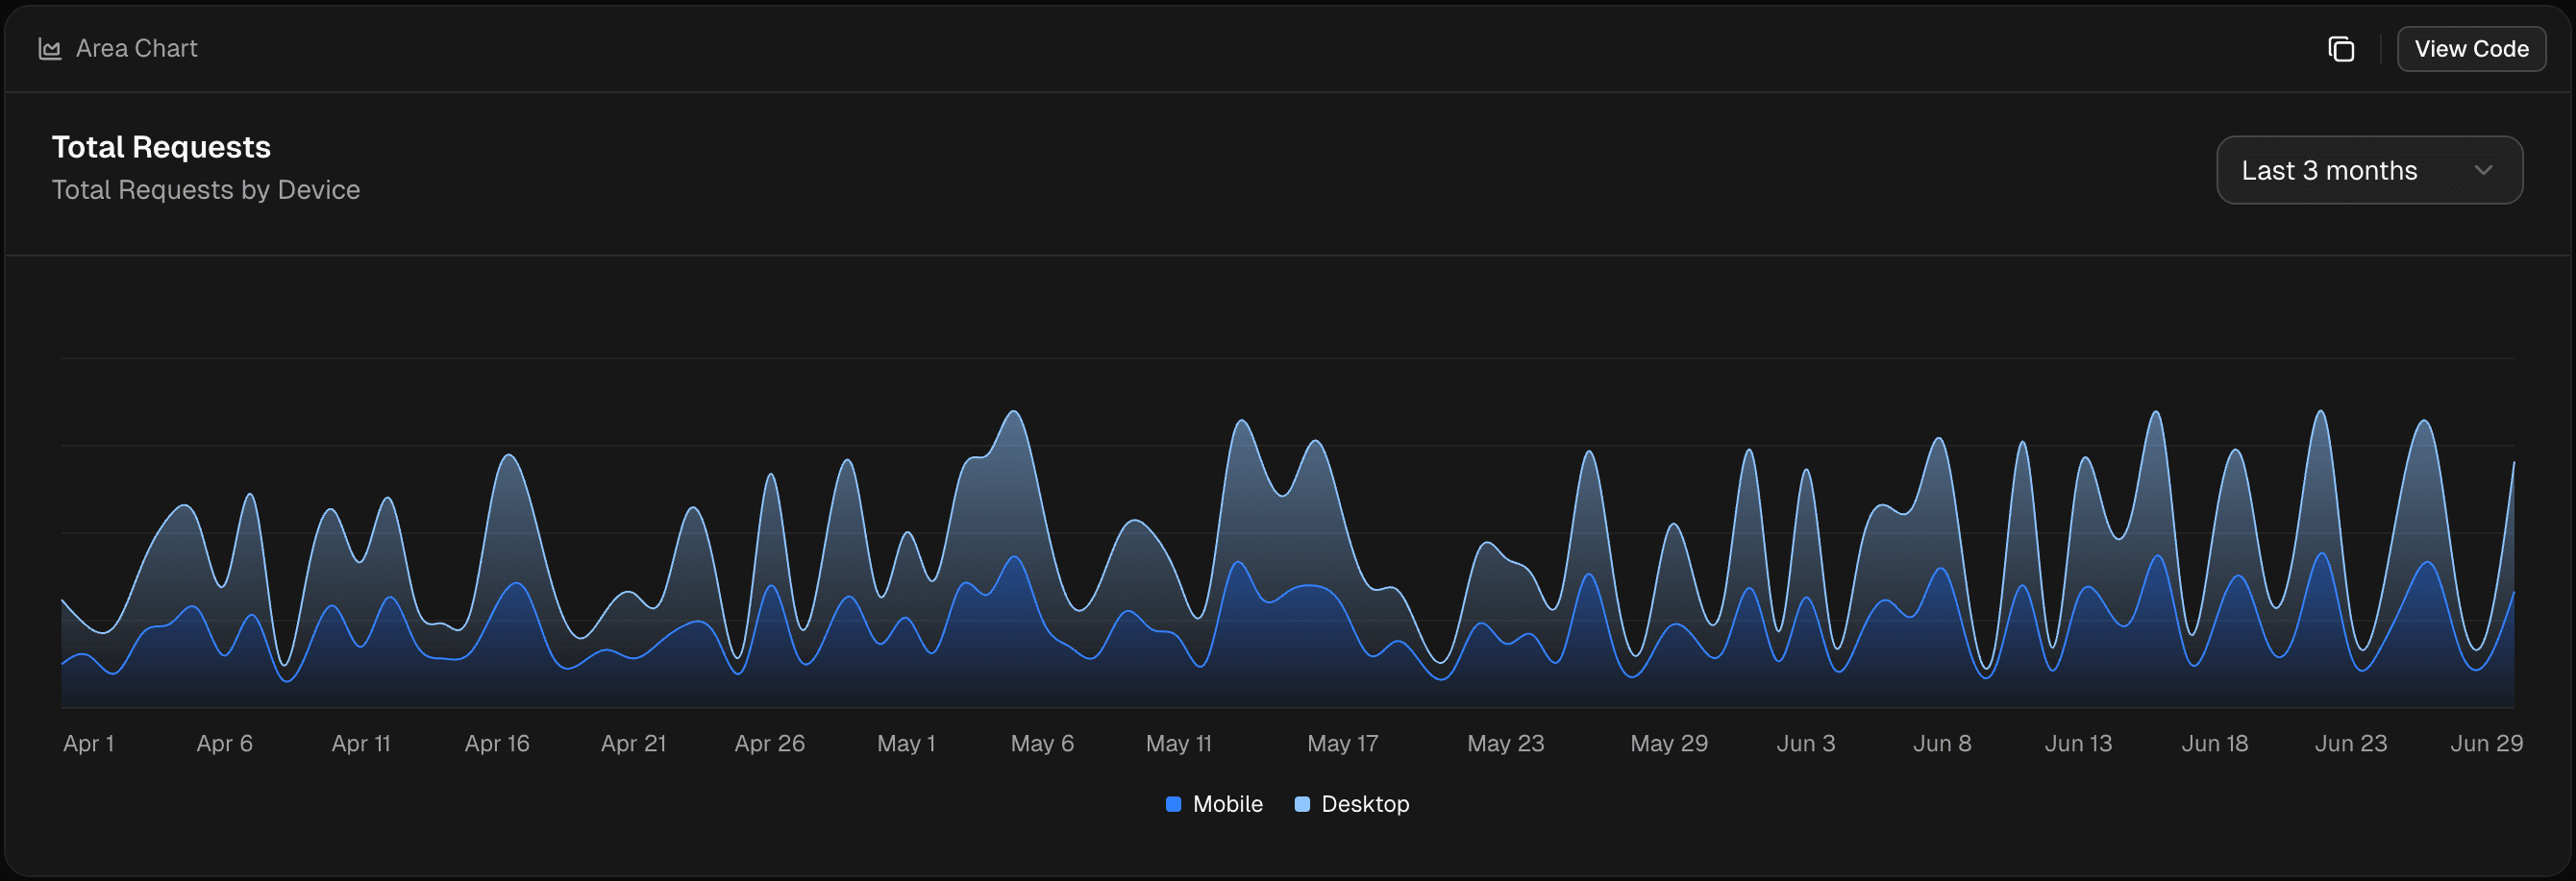
Custom Dashboards
Build dashboards tailored to your needs. Track requests, latency, database queries, AI usage, and costs—all in one place with real-time metrics.
Fastest trace search
Find any trace, log, or error in milliseconds. Search across DB queries, LLM calls, dashboards, and more.
Built on OpenTelemetry
Native OpenTelemetry support means easy instrumentation for your stack. Drop-in packages for Better Auth, Drizzle ORM, Resend, and more—just add one line.
From frontend to database to external APIs—track every request across your entire application. OpenTelemetry-native tracing with span-level details for complete visibility.
No more jumping between tools. Traces, logs, metrics, and errors all correlated automatically with the context you need to debug fast.
Every trace includes database queries, API calls, LLM usage, and performance metrics—everything in one view.
Find any trace or log in milliseconds. Filter by user, endpoint, status code, or custom attributes.

Your Kubiks Agent monitors every trace and log, automatically detects anomalies, identifies root causes, and suggests fixes—all before your users notice.
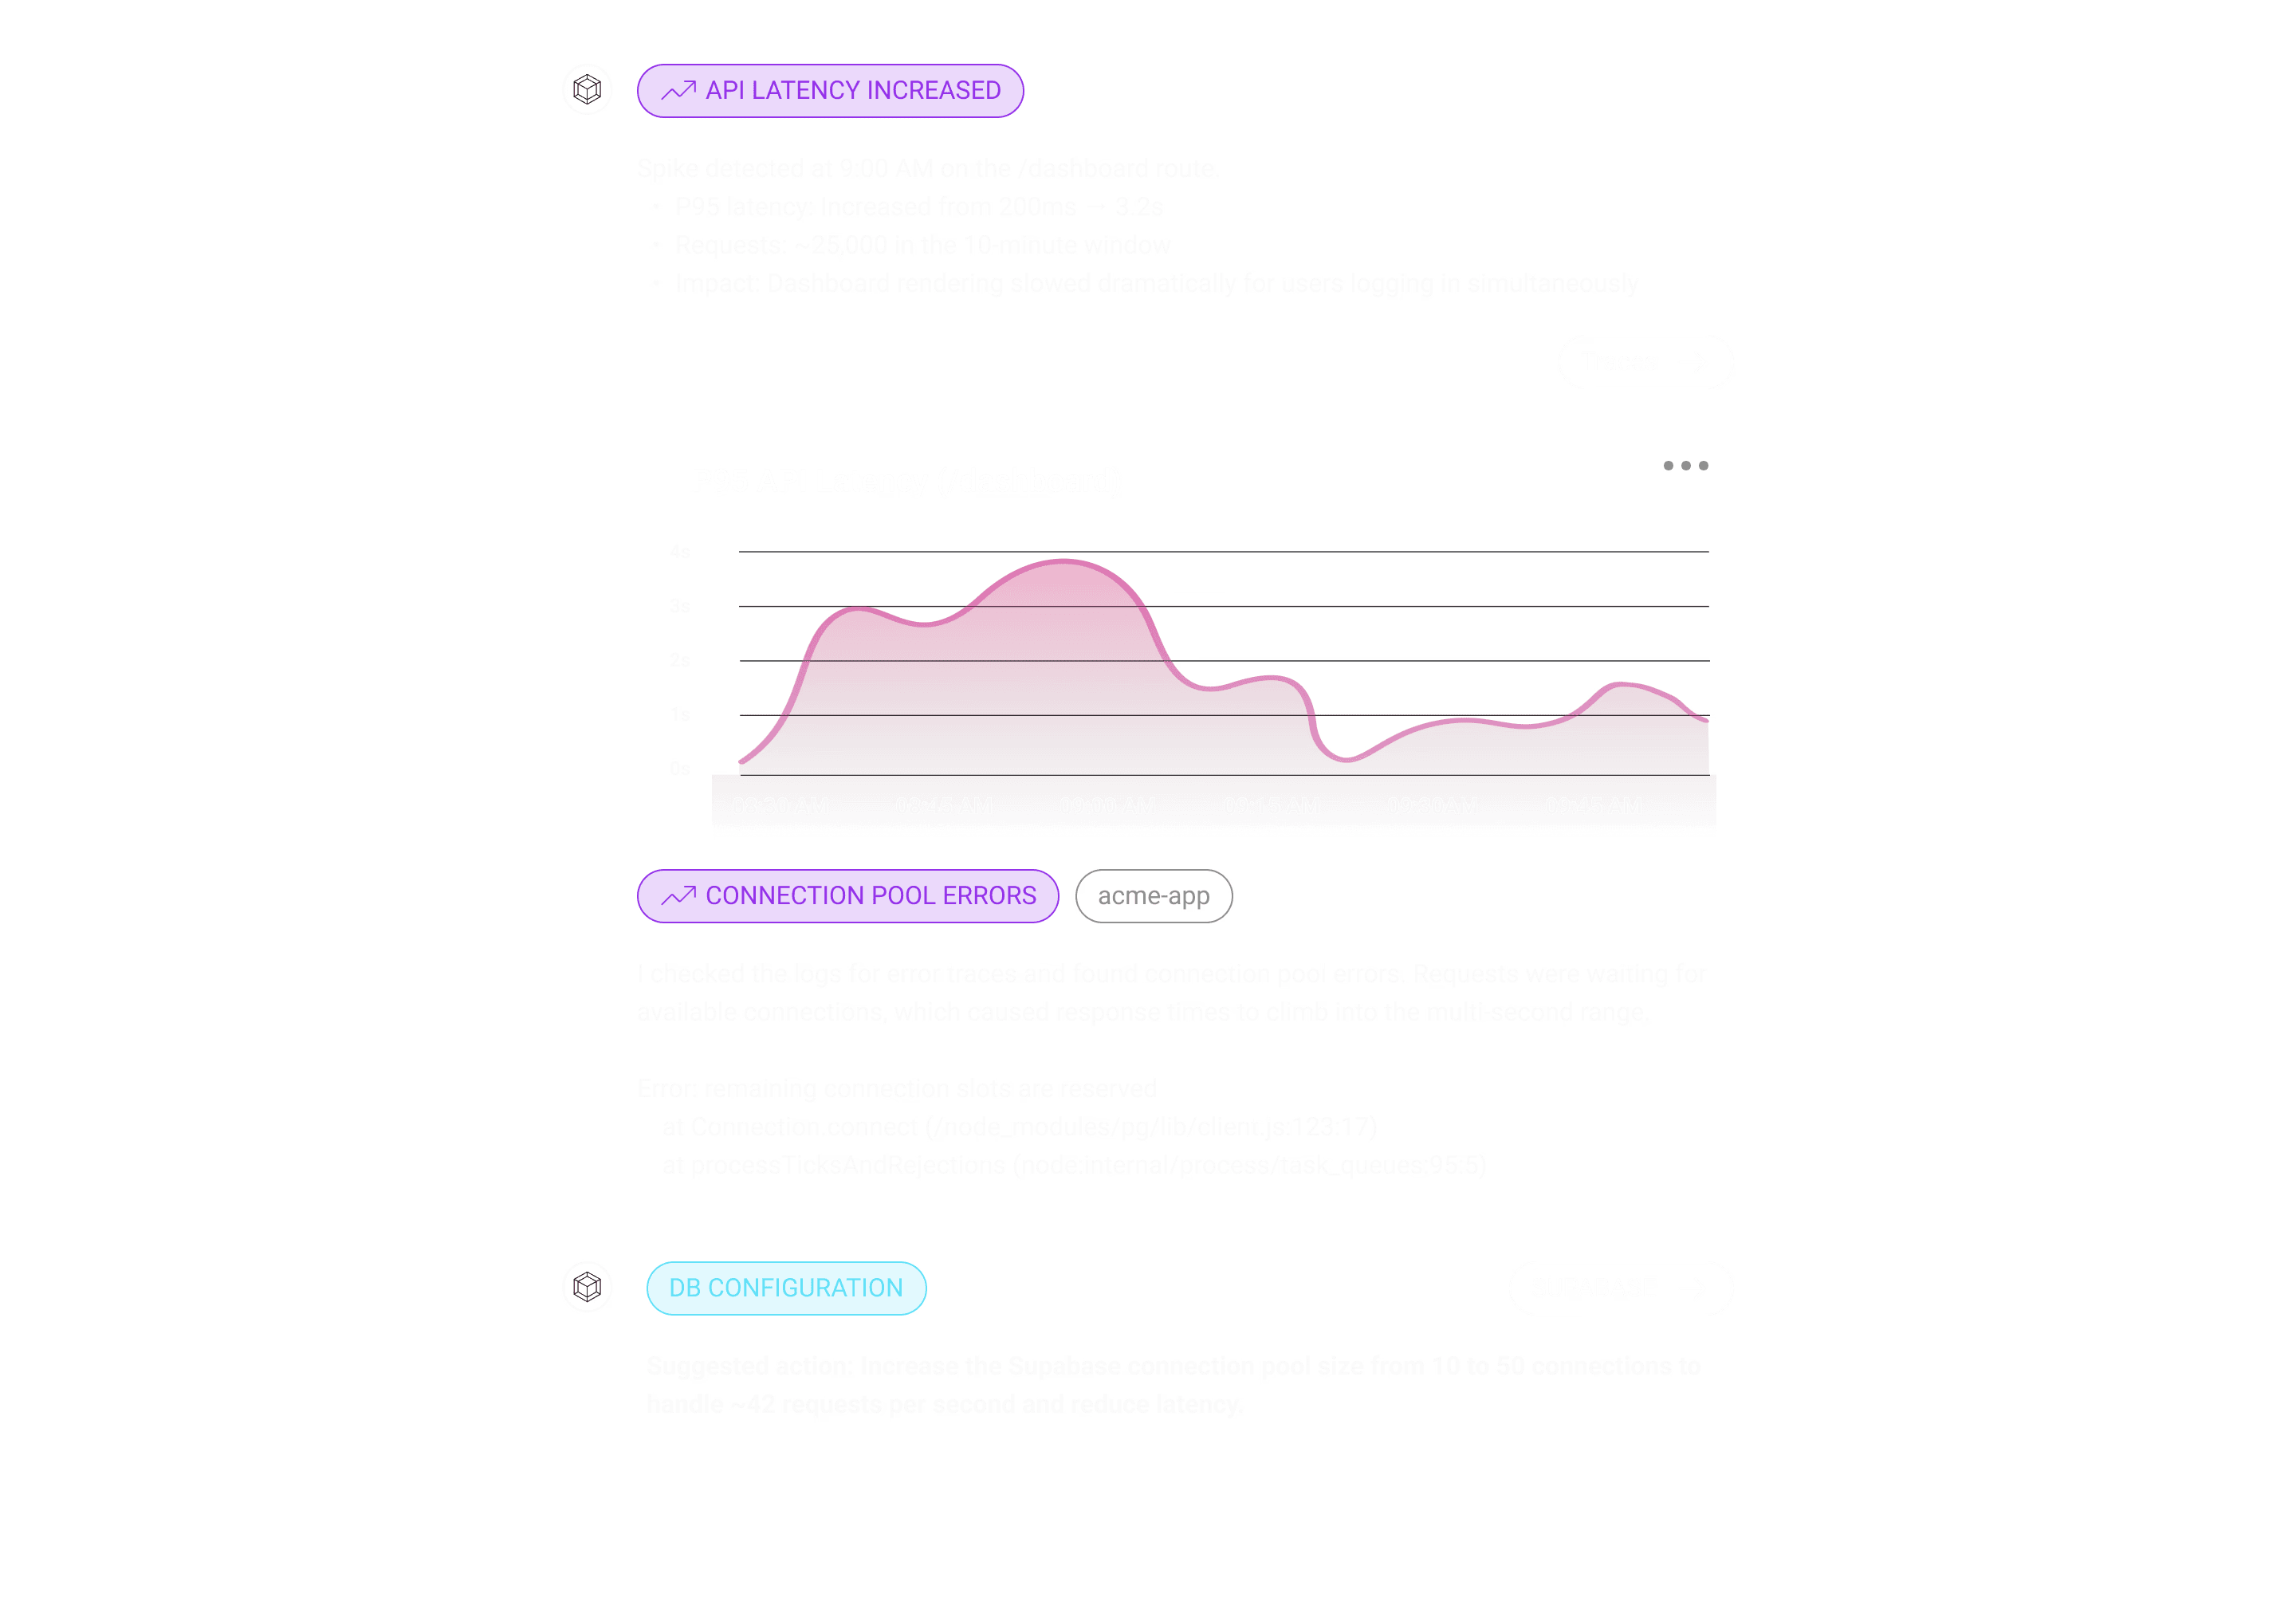
Connects to your source code, telemetry, and cloud provider to give every incident complete context.
Agent generates pull requests with fixes automatically, reducing mean time to resolution.
Works in Slack where your team is. Get instant alerts and chat with Agent in any thread.


We automatically receive log and trace drains from your Cloud Provider. Connect your telemetry sources with zero code changes required.
Get StartedNative OpenTelemetry integrations for your favorite TypeScript libraries. Zero config, automatic instrumentation, and rich trace context.

Add distributed tracing to database queries with support for PostgreSQL, MySQL, and SQLite.

Complete auth observability across all authentication flows, OAuth, sessions, and account management.

Trace MongoDB operations, queries, and aggregations with collection and execution details.

Monitor message queues and trace workflow executions with detailed performance metrics.

Instrument Autumn billing operations including feature checks, usage tracking, and checkout flows.

Trace ClickHouse database operations and queries with detailed performance metrics.

Automatically trace inbound HTTP requests with comprehensive request/response metadata.

Trace workflow executions, steps, sleep operations, and API calls with detailed performance metrics.
This is absolute hot shit brah
This immediately goes to the list of things I need to add to our current project 🤤
Man this is sick
Thank you 🙏 starred the repo as well 👌
It took me just 10 minutes to set up Kubiks even with our non-standard Next.js setup. My team immediately started getting valuable insights. The app is intuitive and simple, giving us exactly what we need: Slack alerts on errors and interactive tracing to quickly debug issues. Most importantly, it helps us monitor and resolve user problems before they even reach out.
Drizzle just got even better
I was able to setup it using kubiks-cli. Looks very cool, thank you 🙏
Bro is dropping one big thing after the other
Oh that is sick
First tool I've used that captures everything out of the box — full trace context, instant alerts, zero setup hassle. It even caught a production issue I wouldn't have noticed otherwise and let me fix it in under a minute.
Just got my Drizzle setup to log every query I ever make… now I can see the exact moment I lost my soul to this ORM
Resend just leveled up with OpenTelemetry
Looks clean, great job!
Kubiks is everything I wanted in an observability tool — super easy to set up, no need for manual tweaking, and I get full visibility right away. No missed bugs from misconfigured handling anymore, it just works.
When things go wrong, you want a single pane of glass, one place to help you identify, and fix, what's going on. Kubiks does that. Multi-cloud? Kubiks does that. Running Kubernetes on-prem? Kubiks does that. One place to see it all.
Get full-stack observability with AI-powered fixes in 5 minutes.

